CEO and Founder of DeskDirector Warick Eade guides you through how you should be leveraging your data and analytics dashboard to boost revenue. Walk away with a firm grasp on:
- What your data should be telling you
- Ways your data can be presented in your tech portal for optimal transparency
- How to tell if your business intelligence is untrue
- How to leverage your data analytics to make smarter business decisions
A Sneak Peek
What ITSM Can Do for Your Data
- Daily digests: daily curated data presented concisely, available at your fingerprints so you can consistently know what’s working and what isn’t.
- Dynamic content forms: different ways of formatting and presenting data and content to maximize clarity for your team .
- Intelligent scheduling: innovative methods for scheduling and automation that will keep things constantly in motion, driving up your productivity.

“...We can free our data up, automate it so it comes to us, we don't have to get it, deliver it in the form we wanna have, make ad hoc queries or ad hoc digests for certain situations, and then have that appear easily for you...”
Want More Like This?


Video Transcript
Good afternoon and welcome to the January DeskDirector webinar. This month, we're talking about DeskDirector and the data, how your data analytics can do more for your business, what your data's not telling you, and frankly, why your data's not turning up in that sometimes, we have information that we need to see in our businesses that just isn't available to us and how we can get out of the grind of having to export data out to CSV to get meaningful results. I know in my lifetime for the last couple of decades, I spent a lot of time to get any meaningful information in context of a month or a ticket or a project, export out to CSV and then put it in Excel.
We're showing you today how you can get above that and surface your data where you can assemble it through our automation, so DeskDirector's very powerful automation, you can present it in the presentation tool of yourself of your choice, that could be Excel, Power BI, Grafana, or what you want, and then stage it inside of the portals, both DeskDirector user portal and also our tech portal, so that we can free our data up, automate it so it comes to us, we don't have to get it, deliver it in the form we wanna have, make ad hoc queries or ad hoc digests for certain situations, and then have that appear easily for you, and you'll see this is not a trend that we're starting. You can see that through all your marketing tools, we use HubSpot, obviously Microsoft Their digest technology, no more reports, no more (indistinct) aren't here to report, it's like, here's a summary of data from yesterday that you should see, nothing else, and I'm gonna present it to you in Outlook, I'm gonna present it to you in Teams, I'm gonna present it to you in the user portal so you can be informed.
So, the next 30 to 45 minutes, we're gonna run through that and show what you can do with your DeskDirector software. So, the agenda for today. We have a brief announcement of our new Windows versions. It's relevant to our data in that the new versions can host reports and portals from our products, so in the user portal, you can now embed Microsoft 365 admin portals, so for safer licensing, you can embed that in the application, we'll pick up the user AD account and show that there, again, surface data, Microsoft has a fantastic digest they produce online for the Microsoft 365 customers. We also have a tech portal release for Windows, version five, and that's very powerful as well. We can now bring in the presentation layer with Power BI reports. We can bring in IT Glue documents, we can now host, fully host embedded in the two PSAs, Autotask and ConnectWise, to give you one unified experience for your interactions and for your data.
And the Excel automation we're gonna show you today where you can bring live digests into your tech portal. So lists of tickets that make sense, here's the tickets you should work, here's the tickets that are stale. Here's the tickets I wanna see as a service delivery manager, the tickets that are stale beyond a few days, tickets that have been ghosted where they don't have an assigned taker or owner, where they are closed, silent closed, so they go to closed without email and an internal note. I wanna see those and we can show you a way for you to surface those and not have to go in and search them, not have to maintain a view and go and power that. This will come to you. We'll assemble it, we'll stage it. So there's three parts to our data story.
Firstly, we use automation, that's our Power Automate flows in our premium connector and Power Automate, to assemble your data, so on a daily basis, on an hourly basis, when tickets get updated or created, we can start a workflow to go to assemble that data, no more manual exporting of CSVs, no more manual setting up of views or changing views.You can set up workflows to find that data for you and get that daily, weekly, or on particular events. We're gonna present that data. And a lot of today is about Excel and Power BI, but if you have other presentation tools, if you just wanna put it into a PDF, if you wanna send it as an embedded email, we can, once we acquire that data, we can assemble it, we can send it to you. And then lastly, the third piece, we can stage, sorry, we can stage the data in DeskDirector. So as well as obviously with our automation, we can send out to all the communication platforms that you work with, we can stage that data in DeskDirector, in the portal, in the tickets, and in the first demo I'm gonna show today, right inside of forms.
So we can tell people, particularly for expectation setting, tell them what's going on dynamically real-time data in the forms. So first, a little bit of, I guess, higher level thoughts, and this comes from my 32 years in managed services, I still own a 70-person managed services company and I have been doing managed services itself since 2002, which, do the math, is 20 years of experience, but I still have problems and issues over those two decades that just haven't been resolved until DeskDirector came along and rewrote it. And that is one of the continuing problems that we have in managed services is measuring what gets done. We got broad gauges in terms of the overall count. We can't measure the capability, if you want people to run a checklist, I want you to check off the tasks that every ticket you close and an onboarding is done or this SOP is followed or that this close rate is done or I want you to budget tickets, the service principles and practices that the service delivery management and the leaders of the businesses put out, it's very difficult with the tooling that we've had in the past to actually measure that beyond just a lump sum, very, very coarse count of tickets open, tickets closed.
I don't, you know, that's not really a good count. Are the 30 tickets that are open today, is it actually a run, are we slow, did the RMM just throw up a bunch of alerts that, and it's not properly tuned? We need to get better measurements, so better measurements mean better sense of our data, and I'm a huge fan of Tom Peters, he winters over here in New Zealand. Just what gets measured gets done. And you can't get things done unless you measure stuff, and you can't measure stuff unless you're getting proper data. We struggle all the time with incentives, and Charlie Munger is one of the founders of Berkshire Hathaway with Warren Buffett. And this is one of my favorite quotes of his, and it's show me the incentive, I'll show you the outcome. And again, if you incentivize people, if what the company wants and the customer wants is good for the company and good for the customer, aligns with what's good for the employee, everybody's happy, all right. If it's not, if you wrongly incentivize employees or processes, that won't happen. The way you do closes, the way you follow up, those, again, the processes and practices that you write, you have written in your proven processes, you need to incentivize against that. And to incentivize, you need to have correct data, you need to have that data coming to you, you can't have an incentive program where data is buried and you gotta manually go dig it out once a month and print it out, it needs to be real time in front of people. Lastly, another person I'm fan of is Matt Watkinson, who wrote The Ten Principles of Great Customer Experience, and that's about expectation management, this is something we do ad hoc.
And again, setting expectations and then meeting them, if you don't set, it's gonna, quote unquote, if you don't set expectations in the process, expectations will be set for you, there'll be set by outside forces or by previous experience. And to set expectations and manage them, again, you need to know what's going on, you need to have data appearing in the ticket in real time. This is what you can have, this is when we're gonna get back to you, this is what the experience is, this is how many tickets are open. And so this is why data's really important and, you know, I think that the truth of it is, from the hundreds of MSPs that I talked to, a lot of people are flying not so much blind, but in a lot of clouds and mist. We wrap up at the end of every month and we might wrap up every week, we'll have broad indicators, we'll know how far we are from the ground in terms of our gauges, but beyond gauges, we don't have a lot of data on what's going on. And we certainly, when we drill into a ticket, it's a case of reading it, finding bad tickets, reading it, and then having to work in it rather than the automation finding that for you. So that's the drive. You know, what gets measured gets done, it needs to have good data. Show me the incentives, I'll show you the result, we need to have data to incentivize properly and expectation management needs data as well.
So that's the driving forces today behind my talk and about data generally, the information that we have about what's going on, what times the service, amount of money we spend, the expectations we set, and the incentives that we've set and follow. So that's the talk today. A very quick two-minute announcement about our new Windows clients, and they're very relevant to our data story. We have a new portals rewrite, totally, we've had the Windows user portal since the beginning. And it's been an Electron app, we've rewritten it. It's been a .NET app than an Electron app, now it's back at .NET. It's using the same stack as Outlook and then the next version of Teams, so we're a little bit ahead of Microsoft on this. Very small footprint, natively can pick up Windows logged in sessions and AD. But that piece in black, we can stage other admin consoles and reports, and most importantly for our customers, we can stage all this in Microsoft 365 admin pages. So, things like licensing now, and I'll show you this later, just falls out, the data from licensing, what licenses do you have in Office 365, absolutely available now in the user portal where users have requests, where they look at the data, where they manage the IT processes, we can bring that information in.
We have a new tech portal as well, rewrite, same technology, much smaller footprint, native app. But we can host ConnectWise Manage and Autotask inside of it, so if you work on a ticket and you wanna drop it into Manage or Autotask, you can see that. We can host, we're just using a native Edge browser. Again, we can host Excel and Power BI Reports. If you remember our three bars, you know, assemble the data, presentation layer, and stage it, if you can get data into Excel, we can, via our automation, you can build a spreadsheet using our automation. So that's gonna be updated in the minute as tickets change. And then you can bring them that data into the tech portal and then use that to find tickets and work stuff, so again, surfacing data in the right place where people are working so they don't have to go away and find it. Not going back to a view, refreshing, or having, you know, strange views or just generally, you find that outside of the views you have, there's just darkness. So when you set up reporting and the screen that says, this is my view, this is all I've got, outside of that is darkness, when you've got automation bringing data to you, we're bringing data, we're going to look in the whole dataset you have and bring in data to the tech, to the service manager, to the customer, that's important to them, and we've decided that's important to them at the beginning, weeks before or month before, and automated that.
So, this is what we're gonna show today. Assembling the data with automation, presentation in Power BI and Excel today mainly, but remember, of course, with our automation, we have over 500 apps we can push into. So, wherever you wanna stage your data and present it, as long as it's a cloud-based app or cloud-based presentation layer, we can do it. And then with the new Windows clients, we can stage it and DeskDirector and make that data, that presentation layer, live as a first-class citizen with your other information. So, let's flip into it. I mean, I guess what we're trying to show today is that data is trapped a lot, we squeeze it out, but basically, my MSP uses ConnectWise and while inside of ConnectWise, there's some data in there inside of Autotask, there's things you can do, but to get it out, you really can, you need to export it. You can, really, in the last three decades in my, I've been exporting to CSV regularly. I've been through the cycles, an owner of an MSP where I, to get anything meaningful, so I can get gauges that can give me, hey, there's a count of tickets, but to get anything meaningful, where did that count come from, what's going on, I am just perpetually exporting to CSV, then into Excel, then running a pivot table, and then I'll work that for an hour. And then a day or a month later, I'm gonna do it again to find out the stuff.
So, we need to get out of this cycle, get data out of jail. So, we don't, we're not exporting to CSVs all the time. I mean, we'd export out, this is ConnectWise, this me exporting out to CSV, I've done this, I can do this in my sleep, I've done it so many times to try and get it out. Point being there's nothing wrong with Excel itself, it's just that we shouldn't have to go and get the data, it should come there. And this is a little preview of a dispatch spreadsheet that we have an automation creating. So, this spreadsheet here is a particular board. It's going in and creating this dispatch board and it's creating. This is the Excel spreadsheet, but it sits, and you'll see later on, it'll sit inside DD Tech. And every single one of these tickets can be opened here. But being Excel, you've got all the capability and filtering process that you'd have by exporting to CSV, but it's all live, it's all updated, and you can choose what data appears here. And you can have multiple spreadsheets or multiple tabs or multiple worksheets. You can have pivot tables; you could have data graphs and charts in here live inside of your ticket. So, this ticket, this spreadsheet here is assembled by automation. It's presented in Excel.
And you'll see later on, staged inside of DD Tech. And that is the data story, getting data out that makes sense to you, bringing it to you rather than you going and getting it, and presenting it the way you want it. So, let's go have a look at that, rather than, you know, export to CSV to me is pretty much basically talking to your data over telephone. You get a brief dump of it, export it out, it's high, for that brief moment, you have high bandwidth conversation, and then it's all done. Let's move on and liberate our data. So, the principle of our data program is that data should be on the move. Use our automation, I'm gonna show you our find tickets action and our flow is a very, very, very powerful tool for this. Data should find you, so you should not go looking for your data, it should find you, and that can be big as in like, how much money do I make? And that can be small, I want to know if this customer or these people I've tagged white glove ever wait more than a day or ever put a comment that waits more than a day or ever have a, you know, X number of internal notes.
Those things that you see when you look at a serious board and you take time to go down and look at it and say, this is not right, you should be able to codify that and say, these tickets aren't right, this behavior's not right. I want to know every day or once a day or once a week when that behavior happens, and I'll show you some of what I call ghost tickets, which is a particular bugbear of mine, how we can do that and bring those tickets up. But that you have your own particular style of service, your own particular behaviors, I've seen MSPs that want to budget every ticket and techs that, some techs that will go and mess with the budgets, you wanna see that behavior in action. Again, what gets measured gets done. You can then align incentives around there and then set expectations not just for customers, but also for your techs and the behavior that will be rewarded and the behavior that won't be. I mean, again, the data should find you.
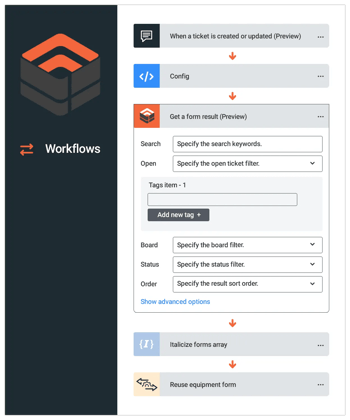
In New Zealand, we're a sheep-growing country, we have lots of sheep dogs. They control the data for you, they corral it, you don't do it yourself, and I think we need to get out of the mode that gauges, you know, don't do a lot for us, we need to have intelligent data coming to us and the tooling that we use. And that's what we're gonna show you today. So, the first thing I wanna show, and this is a feature that's been around for a good five-six months now, is dynamic content inside of our forms. And so, this, we should always start with the customer and put data in there, and you'll see, this is a form we have on our demo sites. And these cards here are dynamically populated. So, whenever this ticket is created, it goes away and tells the customer how many tickets are open, how many in the last 31 days for you personally, across the company that are closed, current calendar. Now, down here, we've done a search based on this request type. And this list here, again, we'll populate help docs that are useful. We're going away, what happens is when this form gets fired, it goes away and it goes looking for data and brings it, assembles it into a card, and we stage it in a form.
So, let's go and have a look at that process, you'll see this form here, that will change every time this form is open, that will change, that will change, and this list will change. So, this is a great, down here, super powerful way of assembling the data, assembling the help desk articles or help docs or knowledge base or any relevant links you think might be useful. What happens when this form fires up, we have an automation that goes away, it says what might be useful to our customer to help themselves or to help them tell us what they want. Let's go get that and assemble that. So, let's have a look at that, so let's go have a look at that process. So, if I come down here, I'm gonna go down to my demo site. I'm gonna go into a new ticket. And now I can go through here into the showcase. And you'll see that the, that little timer there, it's going away. We've just run our work first, it's gone on and polled all the tickets in the system. It's found 17 open, 11 closed, 18 across the board, and one user, and it's found these articles that are relevant to this ticket. So, if I come down here and I go just create a test ticket and save that, submit that, you'll see that when I, next time I do this, it'll go 17 open and 11 closed, it'll go to 18 open and 11 closed.
And then if I come down, back into here, so someone else comes into that ticket, they can see that information as well. So just a really good example of showing content, dynamically bring information to it, these cards are whatever you wanna be. So, this is like little gauges, live gauges, in the ticket, you can put into it dynamically, so closed, open. If you were tracking resolution time or response time, you could put that in here and you could do an automation saying, this is our average response time for you, this is our average response time for this type of ticket, this kind of ticket. This is our average resolution time for this kind of ticket. Start setting expectations about how that would be and then ask, is that okay? This list down here is live, it's going away, and it's just making decisions about the answers based on the information up here.
Here are some documents that might be helpful and stuff. So, in our forms themselves, this has been there for a while, in our forms itself, we have the ability to go off, we're running, there's a flow setup behind this in the designer, it goes away, finds that information, keeps track of it, and brings it to you in the ticket. So, we assemble the data, we present it in the form, and we stage it in the portal. So that's a really good example, first up, of a data story going off, this could go anywhere, this could go to here's the machines you have, here's the data, here's the versions you have. Whatever information you need to have to put into the ticket to give your user more context, we can do that as well. So that's form automation. So we have also data on automation as well, so we can come down and show you some of the embedded data types we have, so we can update and embed Excel, and I think we've used Excel as a tool, you know, the manual export to CSV is problematic in that it's manual and it has a CSV stage where you can't control the data, but Excel itself is an excellent tool to analyze data, it is the most widely tool that we have.
And what we can do, and we have workflows to do this, to update and embed. And this becomes an automated dispatcher for you, so if you see, we have a workflow that does look for unassigned tickets and we have, in our solutions gallery, a round-robin dispatcher, that same flow can be extended to actually write out what's being dispatched and the status of it and come through there and tell people. So, we can embed this in here, and this is a good opportunity now to introduce to you the dynamic site, the tech client show you that data coming in, so if I come down here and fire up my Windows client here, you'll see I have, for those that recognize this, this is classic DD Tech down here, but I have this ticket state here. And this spreadsheet here is being run, automatically updated on a event-based, whenever a ticket gets created, a workflow starts, and it just sits there and lives on that ticket and looks at its status. And we can bring this data automatic into Excel that if anything new arrives, this will be added into this ticket. And this is running here inside of DD Tech, so if have, open up a ticket from here, I can work that.
So, let's go through and look into here, you'll see the ticket opens up. This is all inside the same app, this is a, and then if I wanna see that ticket again in ConnectWise or Autotask, I click on there and then open up in manage. This is all within the same app. So, we have a spreadsheet here that's looking at a board, it's going through, it's working out the ticket, it's working out the company name, I've obfuscated those, the connection side of it, the information, we've got schedule, we can color code this, and all of the (indistinct) of Power BI are available to us. We can create pivot tables, we can have particular tabs, as many as we like, we can put logs. So, I could fill out and have a ghost tickets tab where I have tickets that are unassigned or silent closed or not appropriate, so that are outer band, and that outer band can be set inside of our automation. So, when we say outer band, if you can describe the tickets you're not happy with, and that can be both just properties in it or time or particular customers that you want to have different sensitivities to, you can do that, and there could be a separate list here.
It can be a, this can also branch off a notification, so as it comes here. And so we can grab this data, look at it every couple of minutes or every hour or once a day, we can analyze it as it changes, we can escalate it, we can work this ticket up here, and then we can embed it and show this data inside the system. This is a spreadsheet, so this is really good, and you get that. You can create views, you can run that view as well, you can filter other views. You can obviously sort any of these properties as well. You could go and get other information, so you could go and poll your obviously DeskDirector for your tags to see if there's a 24/7 or a white glove client and then show that differently. You can also use, go look at your CRM system and say, you know, what is this company doing? What should I be explaining this? And this is where you can start to get intelligent dispatching 'cause you can set dispatch rules up there and make the ones, the rules that you think, the tickets you think should be worked can sit at the top here.
So, you could have this list at the engineering board but also have a list here with your old tickets or the tickets that you want this particular tech to work. So, this can be universal too across the board here, down here could be my tickets and running through it, you can run multiple lists of tickets that can be opened on the system and the view and the style of them can be the way you want to see them. So, you get to choose how this happens. Nice thing being Excel, again, it's portable, you can save this out. So if you wanted to, you can share this, you could work with this on Excel. Still gonna be updated by your automation. Outside of tech, you can save this and work it around. You can just go and grab, hey, these tickets, I don't like them, copy these send them to someone and say, can you have a look at them? This link will persist and you can do it. So it's a really powerful way of bringing the data to you that you wanna see, and then once it's here, you can work it, you can pivot it. You can run all the way through that, and then when you're done, you can close it down and work on something else, but meanwhile, the automation, rather than you finding it, will continually be updating this and continually adding other information to it as you need.
So this is a very powerful digest as a spreadsheet inside of DD Tech so that you can see tickets coming through and updating. We can also send digests outside of the tooling and stage that in Excel, in Outlook, or into Teams, and we have a solution for that in our products. So if I just drop back into our workflow, and so we have digests in the system, and you'll see that we have a digest in our solutions gallery that you can download that shows stale tickets. And what it does is it uses our find ticket action to go find tickets that are certain, from today's date, a certain date time old, age, and then I can, down here, if I, this is the workflow that runs it, you'll see it can be expanded out, it sends out notifications, it will send out to Teams, it'll send an email, but it can also, you'll see that little yellow bar there, that's Power BI, that's a live Power BI model. That is, you can send, whenever a ticket gets updated, you can go and write a live model and have a live dashboard. And again, and that dashboard itself, while it can be in Teams or it could be in Power BI itself, we can host that and host your Power BI dashboards inside our tech, let me show you that in action. So to recall, this dashboard here of tickets is dynamically and consistently being updated by a workflow in the background that's making intelligent decisions about what's gonna be here.
It can be broad across the company, it can be just the tickets for a part, it could be just the tickets out, and we could have multiple, we could have a whole range of here, and we can notify outside this in Teams or in email or our DeskDirector's notification to say, hey, you need to look at this, orders come here and open tickets up and look at those directly. So, but we can also, you'll see up here some clever stuff and up here, some Power BI reports. So we can do, we can drop in our Power BI reports into the system, so they come down here and come in here and put in like CSAT and Chat, that's now loading up a Power BI report against the data that we've assembled, remember, automations assemble this data. In this case, we're bringing in some chat data, so with reports. And being, the chats have done, the chat minutes, who responded, who didn't, being Power BI, it's a very fast report, we can drill down into data, change dates, see what was completed. We also have a survey report here that we have here for the certain dates and elements.
So you can see what's going on in our CSAT system or someone else's CSAT system if you can get access to that data, but we're embedding that and this is all embedded into tech, all embedded into the tickets that are here and all the boards, so very, very, very powerful way to collate that data, we've gone through, we've assembled it, and bringing it in both through spreadsheets and through Power BI reports. So that we, you know, where we're hitting so, and this is to get intelligent data to you on the way through, so get rid of that, so we can start getting, you know, more intelligence into it, again, this is built into, this is a service desk analysis dashboard, it's built into tech, it's built into the tooling that you use every day. I can come in here and see summaries of data, of tickets coming through. And we can start doing, you know, intelligence, start seeing total tickets, seeing they're flowing, who's got the most important, what's the type, distribution type or response type, select a project to filter by, resolved tickets month-to-month, seeing your data in motion. I know there's some other great stuff coming through on Power BI, we're fans of it. Check out Cognition360 as well who are doing some great stuff with Power BI. This is the future, not just, it's not a simple dial that's telling you, well, we've got 10K or whatever.
What's the data in motion, what's been happening month-by-month? What's the rolling seven day average? What's in this data, and then once you find the data that you want or find an insight and you wanna drill down to an actual ticket, let's go in here, let's go find that ticket, and then, oh, I wanna look at this. Let's go and look at this one ticket and find it out and drill right into that data and then make a decision, and then obviously, you can get the right results, we come back to that whole, we're actually measuring what's going on, so it gets done. We're bringing data to expectation management, we're saying, this is what we can do right now, here's the time we can normally resolve this, so you know what's gonna happen. And then we're measuring, you know, I want to incentivize that in very specific behaviors. So, one thing I'd like to do now is show you something, a very specific behavior that we incentivize for, or, in this case, disincentivize for and we don't wanna see, but something that our automation can find that you just can't do with filters and gauges and the tooling that you have outside of DeskDirector. So that we have, inside our solution, we have a standard solution called, in our Solution Gallery, we have a solution called find stale tickets. So, if you go into our Solution Gallery, let's pop into that over here. If you pop into our Solution Gallery here, you'll see that there's this stale open tickets digest.
It's a workflow that goes aways and if you're, you know, speaking to our data strategy, it will assemble all the tickets that are over, untouched for X number of days and then send a digest off to Outlook. It could send it out to Teams or to a spreadsheet into that digest inside of DD Tech so people could work those tickets. But you don't have to stop there, it's important that this is an example, in our Solutions Gallery, we use these for examples for you to build on, so that, while this workflow here has, we've installed this workflow here, we have a stale tickets opens digest here. And down here, this is the solution you put in there, and it basically goes down and sorts out least recently updated is greater than if you set up three days in your workflow. We will return that information and then we'll email those off to you. If you've got other concerns or other tickets you want to see or find, so here's all the stale tickets I have running, right, these are tickets that are over three days old.
That's really simple, but I want to find ghost tickets, tickets that are what I call silent close tickets. Tickets that, particular bugbear of mine, is tickets that either don't have assignees or don't have a contact or have both but silently closed, so the tech will go and put an internal note to say this is done and then close with a close, no email. Now, that might have a legitimate reason whatever, but it's not, generally is not a great experience for your users. Understandable in terms of the, you know, incentivized for, you know, taking a difficult ticket or just in a hurry why you might do that, but unless you measure it, we can't change that behavior. And so, what you can do is take this basic stale and open digest and then go and filter that for different information and send that back and it's, I'd like to show you that an action here in our flows. So, the point that you can create any tickets of interest, you can create automation to assemble those tickets of interest, starting with our standard tickets, so this is a standard template that you've installed from our solutions gallery. That is all of about seven or eight minutes to get going. But what you can do is go in here and then edit it, you can take a copy of it. And it will run and go through and find those tickets that don't line up, so what just happened here is we've gone through and just changed the find ticket side of it so it's finding other elements, and we're doing some more filtering and management of that ticket to look deeper into it. Once this is done, it's just gonna sit here and run, it's gonna run for days, for weeks, for months. So, you're talking about an hour's worth of modification, put this flow in there, and then now at the bottom, we're seeing an email with these kinds of tickets, but you could and we have example code of sending that obviously to spreadsheets or to a Power BI model. And that's what's going on in these elements here, is that we're sending that stuff to a spreadsheet.
So, ghost tickets, we have a ghost tickets list of tickets or any particular tickets you wanted to see or behaviors you wanted to see and you wanted to service, if you measure them, there'll be done. If you wanna incentivize certain behaviors or disincentivize other behaviors, you've gotta be able to see that and have that found for you, so we can do that for you. Remember, of course, all these flows. There's nothing that you can't do by reading a knowledge base, but if you need us to do it, we have a consulting team that can do this all for you as well, so that we can bring in this workflow that has ghost tickets that has just certain behaviors I wanna see and wanna go through. Like I showed you, so that's really a little bit of background about our assembling of the data. It's very, very easy to see and to line up in terms of the, out of our Solutions Gallery, just take our stale open tickets digest and modify that and modify the search parameters in that to find the tickets that you want and then you're good to go.
You can expand it into spreadsheets, and we have examples of that in our round-robin dispatcher and other elements in our Solution Gallery. So we also have a daily digest, digests can also be sent to Power BI and to our notebooks and to management groups as well. So that what we can do as well is, once we have a table of information, we can put it inside of our tech portal as a spreadsheet. We can bring it inside our user portal as a spreadsheet, so in this case, you'll see I've got a, this is a user account, this particular user has said, I wanna have particular tickets to keep track of it. And rather than just grouping them up or manually doing it, we've got this coming through and we can throw the information into this ticket here, into the web portal here and you'll see this Deed and Viper selection. So this particular person, Patrick Smith, who's my demo user, has asked for certain tickets to come in there. We are populating a spreadsheet and opening those guys up so we can find them out there, that is now embedded into a portal, that can be embedded into the web portal but also into the user portal, so click on here.
So we have some very powerful ticket grouping and obviously filters for finding tickets. But if you have particular, in the same way that you as a service manager want to see particular tickets coming through, you may have a high value user that wants to see particular tickets or behaviors summarized for those. And we can set that up as well, again, through automation, this list will continually be populated, moved up and down and closed. And then the user here can simply click on these and open up those tickets when they wanna see them. So if you have a request for certain information to appear from a user, you can meet that request so, you know, against the high value clients that are asking for this information, and you can surface that to them. Another great thing you can do is, and this is a service we have built in available to gold and platinum customers, is if you turn this on, you can have a management group get a daily update, a daily digest.
We have a automation that does this come through and just spits out daily digests, again, updated tickets, close tickets. And then if you want to see that as well all in one view, all isolated from the last three days, and again, you can click in here and just open that one ticket and see it in action, see what's going on. So we can do this for customers as well. So we can line up their digest, assemble the data, stage it, and in this case, we're staging in HTML tables, which we're putting in our notebooks, and then present them and inside the portal. The Windows portal two now allows us to put other people's information and digests in there, so in the same way in the tech portal, we can get the Power BI, Excel, we could put IT Glue, we could get embed obviously ConnectWise and Autotask pages inside our Windows portal now, we now can start putting in on the client side information that other companies like Microsoft present.
So Microsoft has a really, really nice message center that keeps you informed of what's going on with your Microsoft 365 account and the features you have and the updates you have, so if you haven't engaged with your technical customer, you can put this link in. And what's happening here is it's going away to Microsoft and firing up the message center, and we're seeing all the messages about compliance, about new features, all the software you have, whether you run it at all, and this is just out of the box, really simple, one very, very big, it's a digest of Microsoft producers to manage the ever larger features they put out in Microsoft 365, you can present that in your portal and use that data and then have that appear here. You can also, and being able to see things like licensing. So again, we can embed, Microsoft's got a nice report on the licensing this customer has. This customer is a licensing admin so they're gonna see this. And we're gonna pick up their admin account and see all the licensing that's there. And we can go in and allocate it. This is all now in the background. We hadn't had it automated, we've just done a link to this portal, Microsoft's done the work, but we're staging it inside of the portal. And you can stage any other portal list digest that other applications present as long as you have a URL path or Azure ID, it picks up the Azure ID account, and they can go on there and they can allocate licensing around as per the portal.
So again, surfacing other people's data and other people's digests, we can do that as well. Remember that everything Microsoft, as well as having a user portal that we can do here, we can actually go and talk to the graph API and get that information out if you wanted to assemble this in a particular way. And again, it's about bringing meaningful data and meaningful insights from the data, from the huge pool we have, and presenting it in the right time and the right place against it, so you may wanna, for your upgrades or downgrades, that graphs, have these graphs appear in the request form saying you've got two out of three, six out of six Power Automate plans aren't being used. You could surface that data using our automation into the forms. So wherever it's appropriate, you can surface this data into the portal, again, assemble with our automation, push it to your presentation of choice that you like, that can be just HTML tables, that could be Excel, that could be Power BI, and then stage it in our portals. And if it needs an authentication stage and in our Windows portal, and it will work out really, really well. So that's a quick run-through of digests. I'd encourage you to, if you want to see better data and you want to get more information out of your, particularly your tickets, to use our Power Automate premium connector and use the find ticket action, it's very, very rich, very, very rich model in terms of discovery, you can, this is the find tickets. You can go on your keywords, state, any tag you have for company context for the companies, for the context, and the ticket itself that you put against that ticket through our automation or manually, you can search for that, obviously, the boards, statuses, order, and down here, time stuff, is it, when was it closed, when was it updated, when was it created?
And you can filter on that, send that data back, and then write it out, in this case, we're writing it out, sending it to, creating an HTML template and then writing it out and sending it to a tech saying here it is. But in some of our other solutions, we are sending that data out. Let's see, this is an expanded version of that which we've gone through here and it's going out, and that yellow box there, you're sending it live to a Power BI dataset, so live updating for your dashboard and information. And then we can now send it out live to DD notifications, Outlook, send to Teams messages. And this is the power of it, we can assemble the data, we can do it all the time, every minute, every hour, every day. And then we can bring it in the presentation format of choice, whether that just be a straight table or be Excel or Power BI or other tooling that you might have, and then we can stage that data inside of the two regular portals. So this case was going away in the spreadsheets. It's sticking it into Power BI itself and then it's running, sending a Teams message into Outlook and into a notification. So that's the assembly and digest side of data. It comes back to one last thing I wanna talk about is the data lake to go, and this is a service we're launching this month for our platinum customers and will be bringing out later in the year for gold customers. All the work we've done to assemble some of this data into a report, we've flattened out the model of both Autotask and ConnectWise and DD Tech itself for our Microsoft customers and bringing the data into Parquet files, which are very, very easily consumable formatted binary documents that Power BI and Power Query and Excel can consume.
And basically, that is these files here, looking at your data, is your data from, for a company's context, tickets, our surveys, times, and also activities, so we have the insights that we have from the portal, who's using it, who's, which techs are going, using tickets, how much time they spend on the tickets, which tickets they opened, which tickets users opened, we can grab all that data, stick it in a model which we have built out. We've built out all the relationships, and so we have a Power BI model behind that. And you can consume this, you know, if you're a platinum customer, you'll be able to copy these into your own tenancy and then use the model that we give you, the Power BI model we have, to load these data up, we'll update daily. And that will give you your freedom to your data to explore it, no exporting, no, very cleaned up data dictionary.
So no guesswork on which is the primary key. Everything is ticket ID, contact ID is the con ID, so the ID for tickets is ticket ID, not service_rick_ID. And the relationships are all set up, so you just throw your 15 bucks a month to buy your Power BI Pro license. And you can bring this in right to your own models, get us to do some models for you, hire a Power BI consultant or use your own Power BI person inside there, and then share that data around in Teams, in SharePoint and around, wherever Power BI can go, that will go there. And then whenever you need to, because we have deep linking, if you wind up with a list of tickets in the system, you can fire up DD Tech and fire up the, see the behavior or see the tickets, so you can create models that look like this, you know, And then once you get down to individual tickets, you can come in here, and then as long as you use our deep link format, you can open up those tickets in the system. So that's, we'll be reaching out to the platinum customers directly, and you just need to set up a Azure Blob Storage, and then we can start, set up a copy job to copy that over, and that will give you daily updates, a complete, very clean model to explore this data, both in terms of the dashboards itself, but also in terms of your own automations that you wanna run, they can pull those and consume that as well.
So, to wrap up. Presented today our data strategy. Our data strategy is pretty much standard for the 21st century in that data should come to you. It shouldn't be a huge report you do that you've gotta filter down. You should be able to granular, if you describe the data you want, you get digest for techs, digest for customers, intelligent dispatch lists, the full data model in there. And really just, you know, bring your data to life and make it usable so that you can, the data you, the strategies you have around managing and measuring results for management about incentivizing people and setting expectations can be driven by data, measured by data that is sent, that arrives, and you don't have go and get. Before I wrap up, just a reminder that all this work we do, continually putting data into our Solutions Gallery. But we can also write data for you and write these solutions for you, if you can describe what you want, we can put that in place and deploy that for you. We have a, with our solutions strategy, we have a very powerful way of distributing customizations.
And of course, with, for the platinum customers who have the data lake to go, you can just get anybody with Power BI skills or Excel skills that those decks or Power Query can write the stuff for you. So, the beauty of our power strategy of Power Automate and Power BI and Excel is that you can plug into a huge talent pool of Microsoft specialists to write your MSP workflows and data analysis. We've done the hard work to assemble it for you, to make it available for you, you can do that. So, I think that's, over the hour, a rundown of the data solutions we have and the data strategy. We certainly will be expanding on that and bringing more and more solutions to the Solutions Gallery. And expect to see things like ghost tickets, budget management, those solutions appearing in our Solutions Gallery and integrated into two portals so that the data and the usage can be available to you and your customers when and where you need it so that you can make proper decisions and incentivize the correct way.
I really appreciate your time this afternoon from people in the US and this morning for people on our side of the world, you know, very, very exciting for us, where we're going with this, this is something we've been lining up for a couple of years and pretty much it's where the world is going, automating the assembly of data, the assembly of the right information you need to have and then staging it where you are and then making it actionable when you get to it. I don't think we're unique in this or clever in this, but I don't think in the managed services world, there's a lot of it, if any of it at all at the moment. So thank you for your time and look forward to talking to you about data some more.